Earlier this month, DES released its first cosmology results and the largest and most accurate map of the Universe to date. This was made possible by the hours of work of hundreds of scientists collaborating together across the globe.
The necessary analysis to reach this milestone proved to be an important test of intellect, diligence, and perseverance for so many members of the collaboration. Such a significant scientific result, and the effort that went into producing it, needed to be shared around the world.
The task of spreading the DES Y1 results was undertaken by a small group of students and faculty. Below is one reflection on this unique science communication experience.
Telling the World about DES: Year 1
On Thursday, August 3rd, the Dark Energy Survey (DES) Collaboration released the most accurate measurements of cosmology in the nearby universe to date. The decision to announce these results on this particular date was no coincidence — the APS DPF meeting was being held at Fermilab that week, and Stanford Postdoc Daniel Gruen was scheduled to give a ‘DES update talk’ on 5pm that day. The first release of cosmology results from DES is exciting for obvious reasons to a graduate student working for the collaboration (my name being embedded in several of the papers’ epic author lists), but the day before the release it became clear that it would be an even more unique experience than I had imagined. For as many people that it took to publish ground-breaking science, there was left an enormous task for a select few — how do we tell people?
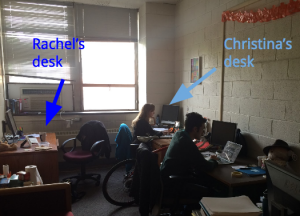
This task falls under the umbrella term “science outreach.” It has become increasingly common for large science collaborations to have some kind of contingent whose responsibility it is to educate and inform the public. Within DES, this is a very small and voluntary group of which I am a part. My closest contacts in the DES outreach group are Kathy Romer (Professor at the University of Sussex) and Rachel Wolf (recent Ph.D. recipient and beloved office-mate who sits directly behind me). These two, together with Brian Nord (scientist at Fermilab), run the show as Education & Public Outreach (EPO) co-coordinators for DES. Normally, Rachel is right there at my back, the ever-and-all-knowing resource who knows exactly what we should be doing and how we should be doing it. But the week leading up to the Year 1 release, she was taking a much needed post-thesis-defense trip. So during our monthly DES outreach teleconference on August 2nd, I was all alone – woefully unprepared for the news that we were doing a SOCIAL MEDIA BLITZ the VERY NEXT DAY. I glanced over my shoulder, trying to will her into her desk chair. But alas, she was on a plane back to reality, so at least I would have her input on The Day Of.

UPenn DES EPO headquarters, a.k.a my office.
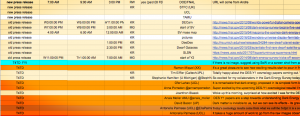
Almost all of the brain power within DES was being used to finish up papers and analyses so the results would be presentable and accurate. It was our jobs to make sure that all this hard work reached as many people as possible. Brian was out of commission, as he was busy organizing and leading sessions for the DPF meeting. Rachel was also unaware of our suddenly-very-immediate duties for the next 48 hours – she was scheduled to fly back to Philly late August 2nd. That left a very excited Kathy, who suddenly-very-immediately decided we were going all out and that all hands were to be on deck. During the telecon, we came up with a plan, and thus the Almighty Spreadsheet was born.
Our goals were two-fold:
- Reach over 50,000 people (scientists, grad students, the general public – you name it!) with the news
- Help people understand what the news is

Behold a glimpse of the Spreadsheet
Of course, we thought the best way to achieve Goal #1 was through social media. DES is active on Facebook, Twitter, and Youtube and regularly updates news and adds longform static content on DarkEnergySurvey.org. We wanted to use this online presence as effectively as possible. I’ve posted for my department on Facebook and Twitter before – mostly news articles and seminar start times, and some pictures from outreach events we’ve done in the Philadelphia community. But our reach never exceeds three hundred people or so. DES has over eight thousand likes on Facebook alone. Thus, the Almighty Spreadsheet was a necessity to manage a posting blitz on all these different platforms. Its purpose was to list all of our content including press releases, DES Thoughts For the Day, photos, and videos – some created especially for The Day Of. Thoughts and links came flooding in that night as we called for DEScientists* to help us out. And so the Spreadsheet grew. Names appeared – including mine – next to cleverly spaced posting times and links that we (the small group of blitz volunteers) were to post on Facebook and then condense for “144-characters-only” Twitter. My main responsibility was managing videos: uploading relevant content to YouTube, then posting alongside cutesy blurbs. And lest I forget, any 16 year old will tell you that YOU NEED A HASHTAG (or seven). Ours was #DESY1Cosmo – short, sweet, and easy to remember. We told the collaboration to use it when posting about their excitement and attached it to all of our posts.
The first blitz post gained larger-than-usual attention on Facebook. It was made 24 hours before the scheduled presentation of the live results at the APS DPF Meeting at Fermilab. It was simply a screen grab of the conference schedule – exciting, right? Apparently! It was pure fact. ‘The results are here <conference link>, and you can hear about them at <precise time>.’ It was enough to get people talking, which is the whole idea of this social media thing. The news officially broke at 10AM CDT on the 3rd with a press release from Fermilab. We made an announcement on Facebook and Twitter immediately with a link to the article, followed shortly by links to the papers on the DES website. People “in the know” were the first to start liking and sharing the posts: scientists, students, and other daily followers. This initial engagement was important to Goal #1.
So our Day Of ended up consisting of a constant back-and-forth of questions and exclamations as we tried to spread out posts both chronologically and by content. Anyone musing about how to use social media might guess that variety is the key. I have found this to be true. The Spreadsheet made a heroic attempt to mix science, candidness, and amusing visuals in a uniform way throughout the day. We’ve observed that pure text posts typically do not perform as well as photo or video posts, for obvious reasons. Some of our more visual blitz posts involved pictures of our DEScientists. One thing I’ve noticed through public engagement is that the life of a scientist is fascinating, however mundane it may actually be. It is such a unique employment in that we are surrounded by some of the smartest people on the planet and get to play with expensive equipment on a daily basis. “DEScientist of the Week” is a weekly spotlight on a member of the DES Collaboration where they answer humanizing questions about their life and work. These have been collected for the past two years and are archived on the website. In the Spreadsheet, we highlighted those who played major roles in the Year 1 release by reposting these interviews throughout the day.
A lot of our other visual posts are the result of observing trips. The Dark Energy Camera (which supplies DES with its beautiful images) is mounted on the Blanco 4-meter telescope at the Cerro Tololo International Observatory (CTIO) in Chile. The South American sky is dark and clear. A common hobby among observers – which consist of DEScientists sent by Fermilab – is photographing and filming the Milky Way and Magellanic Clouds and the inner workings of the telescope dome. I mentioned before that I was in charge of managing video posts. Some of these were reposted observing videos as I just described, and they were as popular as ever. But Post #2 on The Day Of was particularly special to me. At the June DES collaboration meeting in Chicago, I borrowed a video camera from the faculty there and filmed some DEScientists answering questions we’ve received from various outreach events. It was a chance for me to exercise my creative muscles and do something that I’ve been saying I would do for a long time.
Social Media Reach Statistics
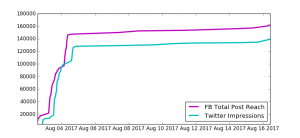
In my experience, scientists have a natural curiosity about most things. Statistics and analysis are fundamental aspects of the work we do, and it is no different when it comes to outreach. It’s not enough for us to tell people about our work, we want to know if we are doing it well. Websites collect data on their usage and make it available to page administrators. We** have looked at this data to see when, how, and why people are actually exposed to what we’re posting. The graph below shows the cumulative reach/impressions from Facebook and Twitter. You can see the sharp rise surrounding the Year 1 Release. The increase in reach and impressions in the two following weeks does not even come close to the impact of The Day Of. Our initial goal of 50,000 impressions on the first day was bumped totally arbitrarily up to 100,000 for the following weekend (the 3rd was a Thursday) by Kathy after the apparent success of the blitz. We reached that goal!

Cumulative exposure during and after the SOCIAL MEDIA BLITZ on August 3rd.
I’d like to highlight some of our “best” posts, which I’m defining as those with the highest reach. You may find them surprising. The pinned post announcing the results was obviously the highest (with currently over 9,000 reach) as it is still seen first by anyone visiting the Facebook page. It was also one of the firsts posts we’ve ever paid to boost — but we’re not really sure how much it helped. Our first post to really take off (7.3k reach) was a selfie from Tamara Davis of the University of Queensland. Her candid & funny emotion apparently struck a chord with our followers., which to be honest, I didn’t really expect, but am delighted that it did. Another popular post was a Thought for the Day about the HBO show “Game of Thrones.” One might expect this would grab attention. Dan Scolnic compared the cosmology release to a “Game of Tension” since recent measurements of this kind have left the scientific community pondering whether they agree or disagree in significant ways.
While The Day Of the DES Year 1 Cosmology Release and the surrounding 48 hours gave us a huge spike in public awareness, we are greatly interested in the daily views and engagement of the DES website and social media pages. Several DEScientists are currently compiling this data and studying it to encourage and inform future large-scale astronomical surveys doing EPO. Stay tuned!
*clever, right?
**Of course whenever I say “we” or “our” I mean so many more people than myself, and usually not even myself at all.
About the Author

Christina Krawiec is a fifth year PhD Candidate at the University of Pennsylvania in Philadelphia, PA, USA. She studies weak lensing with the Dark Energy Survey (DES), specifically magnification of Lyman Break Galaxies (LBGs, bright galaxies in the early universe that have very distinct colors). She loves science education and communication, especially planning demonstrations for children and creating print and film media, which are part of her duties as Graphics Curator and Museum Liaison for DES. You can read more about her here.