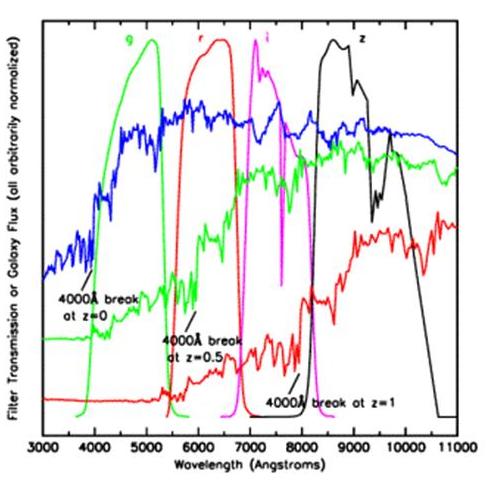
This figure shows the spectroscopic data of three galaxies with redshifts at varying levels, indicated by the blue, green, and red lines. The levels of redshift can be seen by the shift into longer wavelengths when comparing the blue line to the green or red line. 4 of the 5 color bands used for photometry can be seen in the green, red, pink, and black peaked lines, which are used to estimate the redshift without any spectroscopic data.