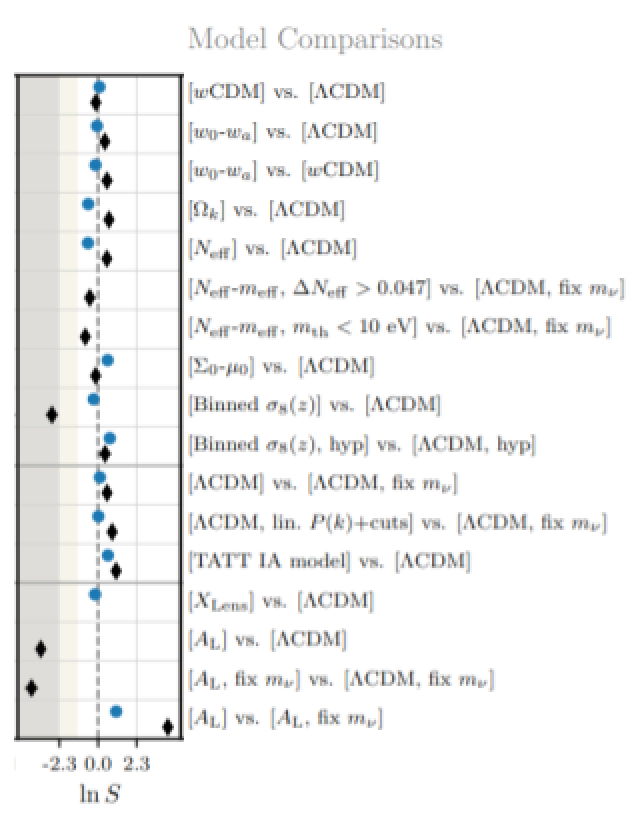
Figure 3: One of the many metrics used to quantify cosmological model preference. The models we compare are listed on the right-hand side and the metric’s values are given in the left-size column. Blue points correspond to values found using DESY3 data and black points to DESY3 with all external data used in the analysis. Negative values correspond to a preference of the extended model, positive values to the standard model, and zero to no preference. Although some points seem very negative, there is, statistically speaking, no preference of one model over another.