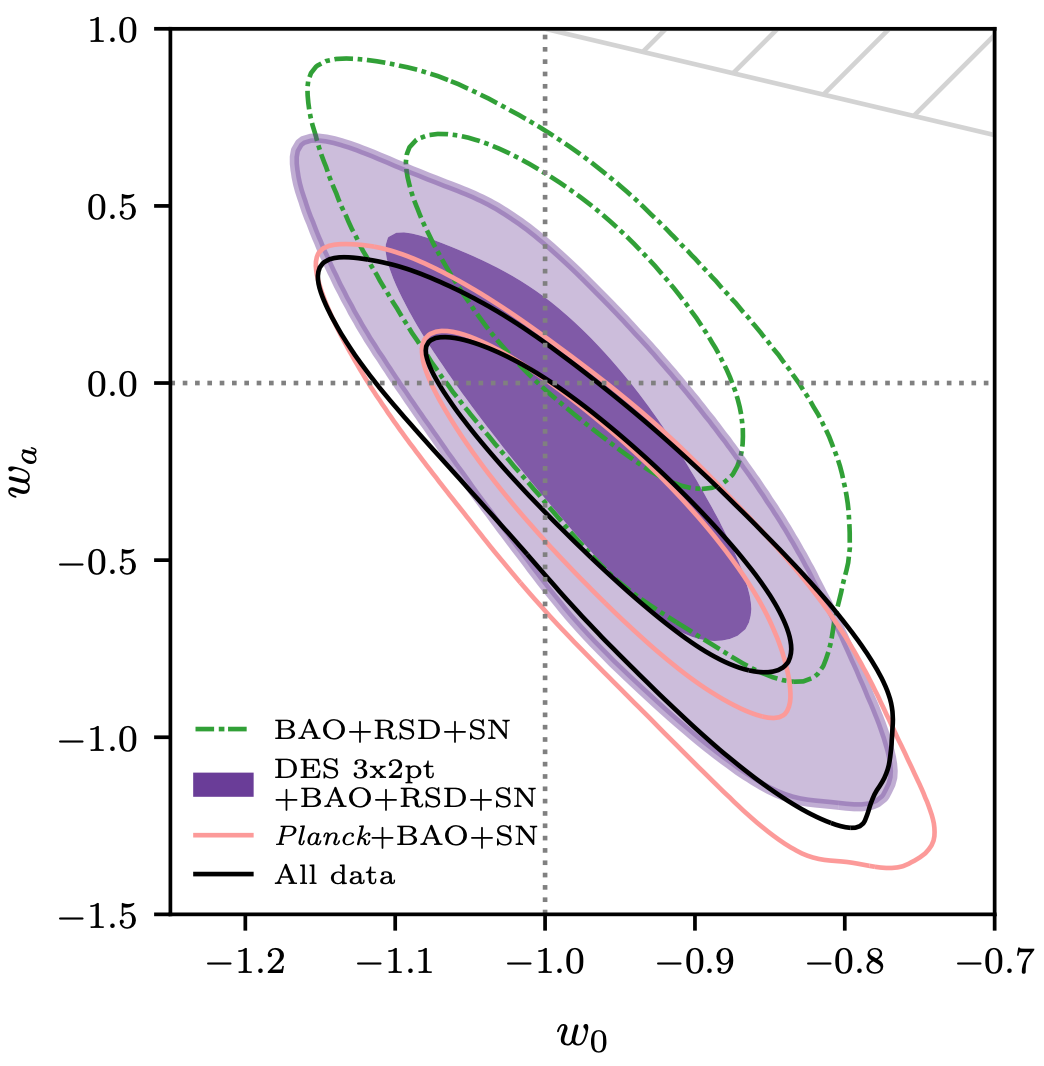
Figure 1: Constraints of DESY3 data with and without external data on the w0-wa model. Contours of the same color represent the same data where each contour represents the likelihood that the true value is within that enclosed region. The smaller contours tell us that the true value is within this region with an 68% certainty and the larger contours with a 95% certainty. The dotted vertical and horizontal lines correspond to the values of the standard model, ΛCDM. We see that the data constrains these values to be consistent with ΛCDM.