This Darchive presents the final DES measurements of the BAO signal, from all six years of data. The full paper can be found at https://arxiv.org/pdf/2402.10696 .
Have you ever thrown a rock into a pond? As many of us have experienced, the rock will make circular ripples that extend outward in all directions. As you watch these circular ripples, you see they grow larger and larger as they extend outwards, until they are out of sight or fade away. How fast these ripples move depend on what is called the ‘sound speed’ of water. What if you never saw the rock, but did see the ripples? You might infer that something happened, and depending on how large the circular ripples were, you could even guess how long ago there was a disturbance.
This situation is similar to an important phenomenon in cosmology called baryon acoustic oscillations. Instead of a rock creating waves in a pond, gravity and gas pressure created repeating, oscillating sound waves in the tiny, dense, hot early Universe. These oscillating waves were like the reverberations of a drum head. Eventually though, the Universe expanded and cooled so much that loose protons and electrons were allowed to combine to form neutral Hydrogen. At this point, these early Universe sound waves stopped, as light and matter weren’t interacting in the same manner anymore. This is also the moment in time (about 400,000 years after the Big Bang) when the Cosmic Microwave Background (CMB) is emitted.

The early Universe created rippling waves, similar to those in a pond. (credit: pixabay)
These early oscillating sound waves do leave a trace in the Universe though. An overdensity of matter would be found at the edges of these early Universe waves, and these overdensities grew into many of today’s galaxies. When cosmologists, people who study the Universe, look for patterns in where galaxies are found today, there is a clear pattern. At the scale of these early Universe wavelengths, now grown by the expansion of the Universe over billions of years, we see a measurable uptick in number of galaxies. In fact, we can see this circular pattern has grown over time with the expansion of the Universe. When astronomers look further away in distance, they see the Universe as it was longer ago. Astronomers do see that this circular pattern of having more galaxies than average is indeed growing as the Universe grows. This pattern, called Baryon Acoustic Oscillations or BAO, is one of the most important tools for cosmologists today.
Not only is the BAO signal important evidence for the Big Bang Theory, it also serves as a ‘cosmic ruler’. This brings us back to the rock in the pond. In the pond, the size of the ripples tells you how long ago the rock fell, or how far away the rock was. The size of this BAO pattern tells astronomers how far away they are viewing galaxies. And like in our previous darchive, when astronomers know how far away something is (and thus how long ago in time we view that object from), and when they can measure the redshift of those objects to measure the expansion of the Universe at that point in time, they can figure out how the Universe’s expansion is changing with time. And how the Universe’s expansion changes with time depends directly on dark energy and dark matter. Thus, the BAO signal is another key tool for understanding these mysterious dark substances that fill the Universe.
That brings us to this DES paper. It presents the final DES measurements of the BAO signal using all six years of data. The analysis focused on about 16 million galaxies of the hundreds of millions found by DES. These galaxies had particularly precise redshift measurements. In cosmology, a larger redshift represents a more distant galaxy, and thus a galaxy from an earlier time in the Universe. The team selected galaxies in six redshift bins spanning from a redshift of 0.6 to 1.2. These correspond roughly to looking at the Universe as it was between 6 and 9 billion years ago. These are effectively the ‘middle ages’, as the Universe is measured to be roughly 13.8 billion years old. The statistical precision of this DES measurement was the highest of any angular BAO signal at redshifts this large (or equivalently, this far back in the past). The analysis is also the most precise BAO signal detection of any that uses photometric redshifts, instead of spectroscopic redshifts, as discussed in our last darchive.
The analysis was extensive, with several aspects studied in detail to check for errors and assess the accuracy and precision of the results. Three different methods of detecting the excess in galaxies, the BAO signal, were employed. All three methods ultimately gave similar results, adding credibility to the result. The redshifts of the galaxies were also estimated in three distinct ways, where again the results were found to be similar with any of the choices. The impact of ‘stellar contamination’ (mistaking galaxies for stars) was assessed. All of these aspects of the analysis were tested in nearly 2000 ‘simulated Universes’ where physically accurate mock distributions of galaxies are made with computers. This allowed the researchers to test how well they could detect the BAO signal in a setting where the size of the BAO signal and parameters of dark matter and dark energy are known.
Crucially, all of this analysis was done ‘blinded’. This means the researchers analyzed the simulations and made their final analysis choices before the data was looked at. Furthermore, the data was assessed for problems in a strict way such that no researcher could see the full implications of the data before analysis choices were finalized. The goal of this blinding is to make sure researchers won’t be biased to make choices that make the final measurements more in agreement or not in agreement with previous studies. Though all scientists strive to be objective in their analyses, studies have shown (even in cosmology) that human biases in various analysis choices have had impacts in the past. Most analyses in DES have thus employed strict blinding criteria.
Results

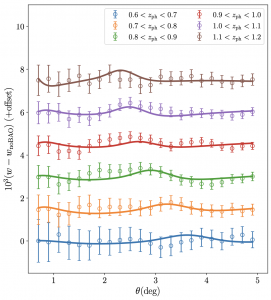
Figure 1: The BAO signal as found by DES in six redshift bins. The y-axis is the clustering of galaxies subtracted by a template without a BAO signal, but is also offset arbitrarily for visual clarity. The ‘bump’ indicates the BAO signal. The x-axis is the angular scales looked at. The bump grows to larger angular scales (to the right) as the Universe evolves. The lower curves represent lower redshifts and more recent eras of the Universe.
With all of the checks passed, the researchers could view the final analysis and see the size of the BAO signal in the various redshift bins. The signal was statistically detected in five of the six redshift bins (spanning redshifts 0.7-1.2). In Figure 1, the BAO signal is the small bump seen in each of the six redshift bins (though it is not statistically significant in the bottom one). The higher up lines represent larger redshifts, and thus further away galaxies, from an earlier time in the Universe. We see at these earlier times, when the Universe was smaller, this BAO signal appears smaller (smaller angular scale on the x-axis). This is due to two factors. First, as the Universe evolves in time (going vertically down the plot) the BAO signal grows with the Universe to larger scales (to the right). Secondly, further away objects from us look smaller, so that’s an additional factor to why the high redshift BAO signal (top) is a small scale, and the closer to us, low redshift BAO signal (bottom) is at a larger scale.
Exactly what scale (how physically big, the x-axis in Figure 1) the BAO signal is seen at different redshifts is a direct consequence of how the expansion of the Universe has changed over time, and thus directly depends on dark matter and dark energy. For the main analysis, the team combined these measurements together and assessed them at the average redshift for the full sample, which is a redshift of 0.85. They then compared the average scale of the BAO signal at this redshift, with what is predicted for different ‘cosmological models’. A cosmological model includes a prediction of the amount of dark matter, dark energy, and a model for how dark energy evolves with time. The ‘standard model’ of cosmology is that dark energy is a ‘cosmological constant’ meaning its density does not change with time. The cosmological constant is often given the symbol Λ (Lambda).

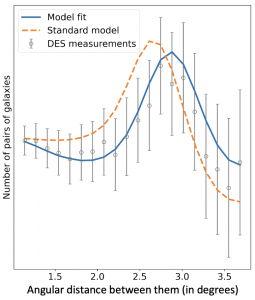
Figure 2: The DES measurement of the BAO signal (bump) combined across the redshift bins shown in in gray error bars. The blue line is the best fit to the DES data. As seen, the measurement indicates a larger scale than the standard model prediction (orange).
The researchers compared the BAO scale they found at this average redshift of 0.85, to the scale predicted by the ‘standard model’ of cosmology. Specifically, they compared with the best fit standard model found by the Planck Satellite’s study of the Cosmic Microwave Background, one of the hallmark studies in cosmology. As seen in Figure 2, they found a somewhat larger scale for the BAO signal (data points, fit with the blue line) than the Planck standard model would predict (orange line).
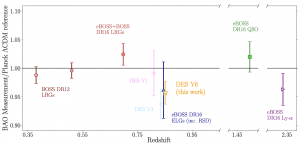
In figure 3, we see the same measurement in a slightly different context. Cosmologists find it a little better to compare not exactly the angular scale of the BAO signal, but the implied distance away of those galaxies based on that angular scale. A larger angular scale like the DES measurement in Figure 2 will mean the galaxies being observed are actually a little closer than predicted. Figure 3 shows different BAO measurements from various surveys compared on this distance metric. The DES Year-6 analysis finds a smaller distance away at redshift of 0.85 than predicted by the Planck standard model, indicated by the black line. The DES measurement is about two error bar lengths below the standard model prediction. While measurements being within one error bar are typically considered consistent with each other, these measurements suggest that more likely than not, they disagree. Of course, a difference of 4 or 5 error bar lengths (cosmologists talk about a similar concept, represented by the symbol σ (sigma)) would be more definitive that these measurements disagree.

Figure 3: The DES Year-6 BAO measurement, and several other recent BAO measurements, compared to the standard ‘Planck’ model represented by the horizontal black line.
If these measurements do disagree, that would imply the standard model is incorrect, or that one of the measurements is incorrect. This study is one of many done by DES and other cosmological experiments in the past decade that suggest that the standard model may be missing something. Perhaps dark energy is not a cosmological constant. The final DES supernova analysis (described in our last darchive) suggested that dark energy may instead be changing with time. That is one possible reason (though not the only one) that the BAO signal measurements don’t fit the Planck standard model. A future paper by some of the same DES authors will explore in more detail what cosmological models these BAO results do or do not fit with.
In summary, the DES BAO team produced a groundbreaking analysis. It was the most precise angular BAO measurement of the high redshift (‘middle ages’) Universe, and the most precise to use photometric redshifts. The impacts on our knowledge of dark energy and dark matter will be investigated in further detail, but as shown here, there are again hints that our standard model may not be correct. DES will have more to say on these questions when its weak lensing and galaxy clustering results are released and combined with the BAO results here and the recently released supernovae results.
Thanks to paper co-author Santiago Avila for some helpful edits on this article. For more discussion of this work, including comments from some of the lead researchers, please see this press release from February 2024.
DArchive Author: Ross Cawthon
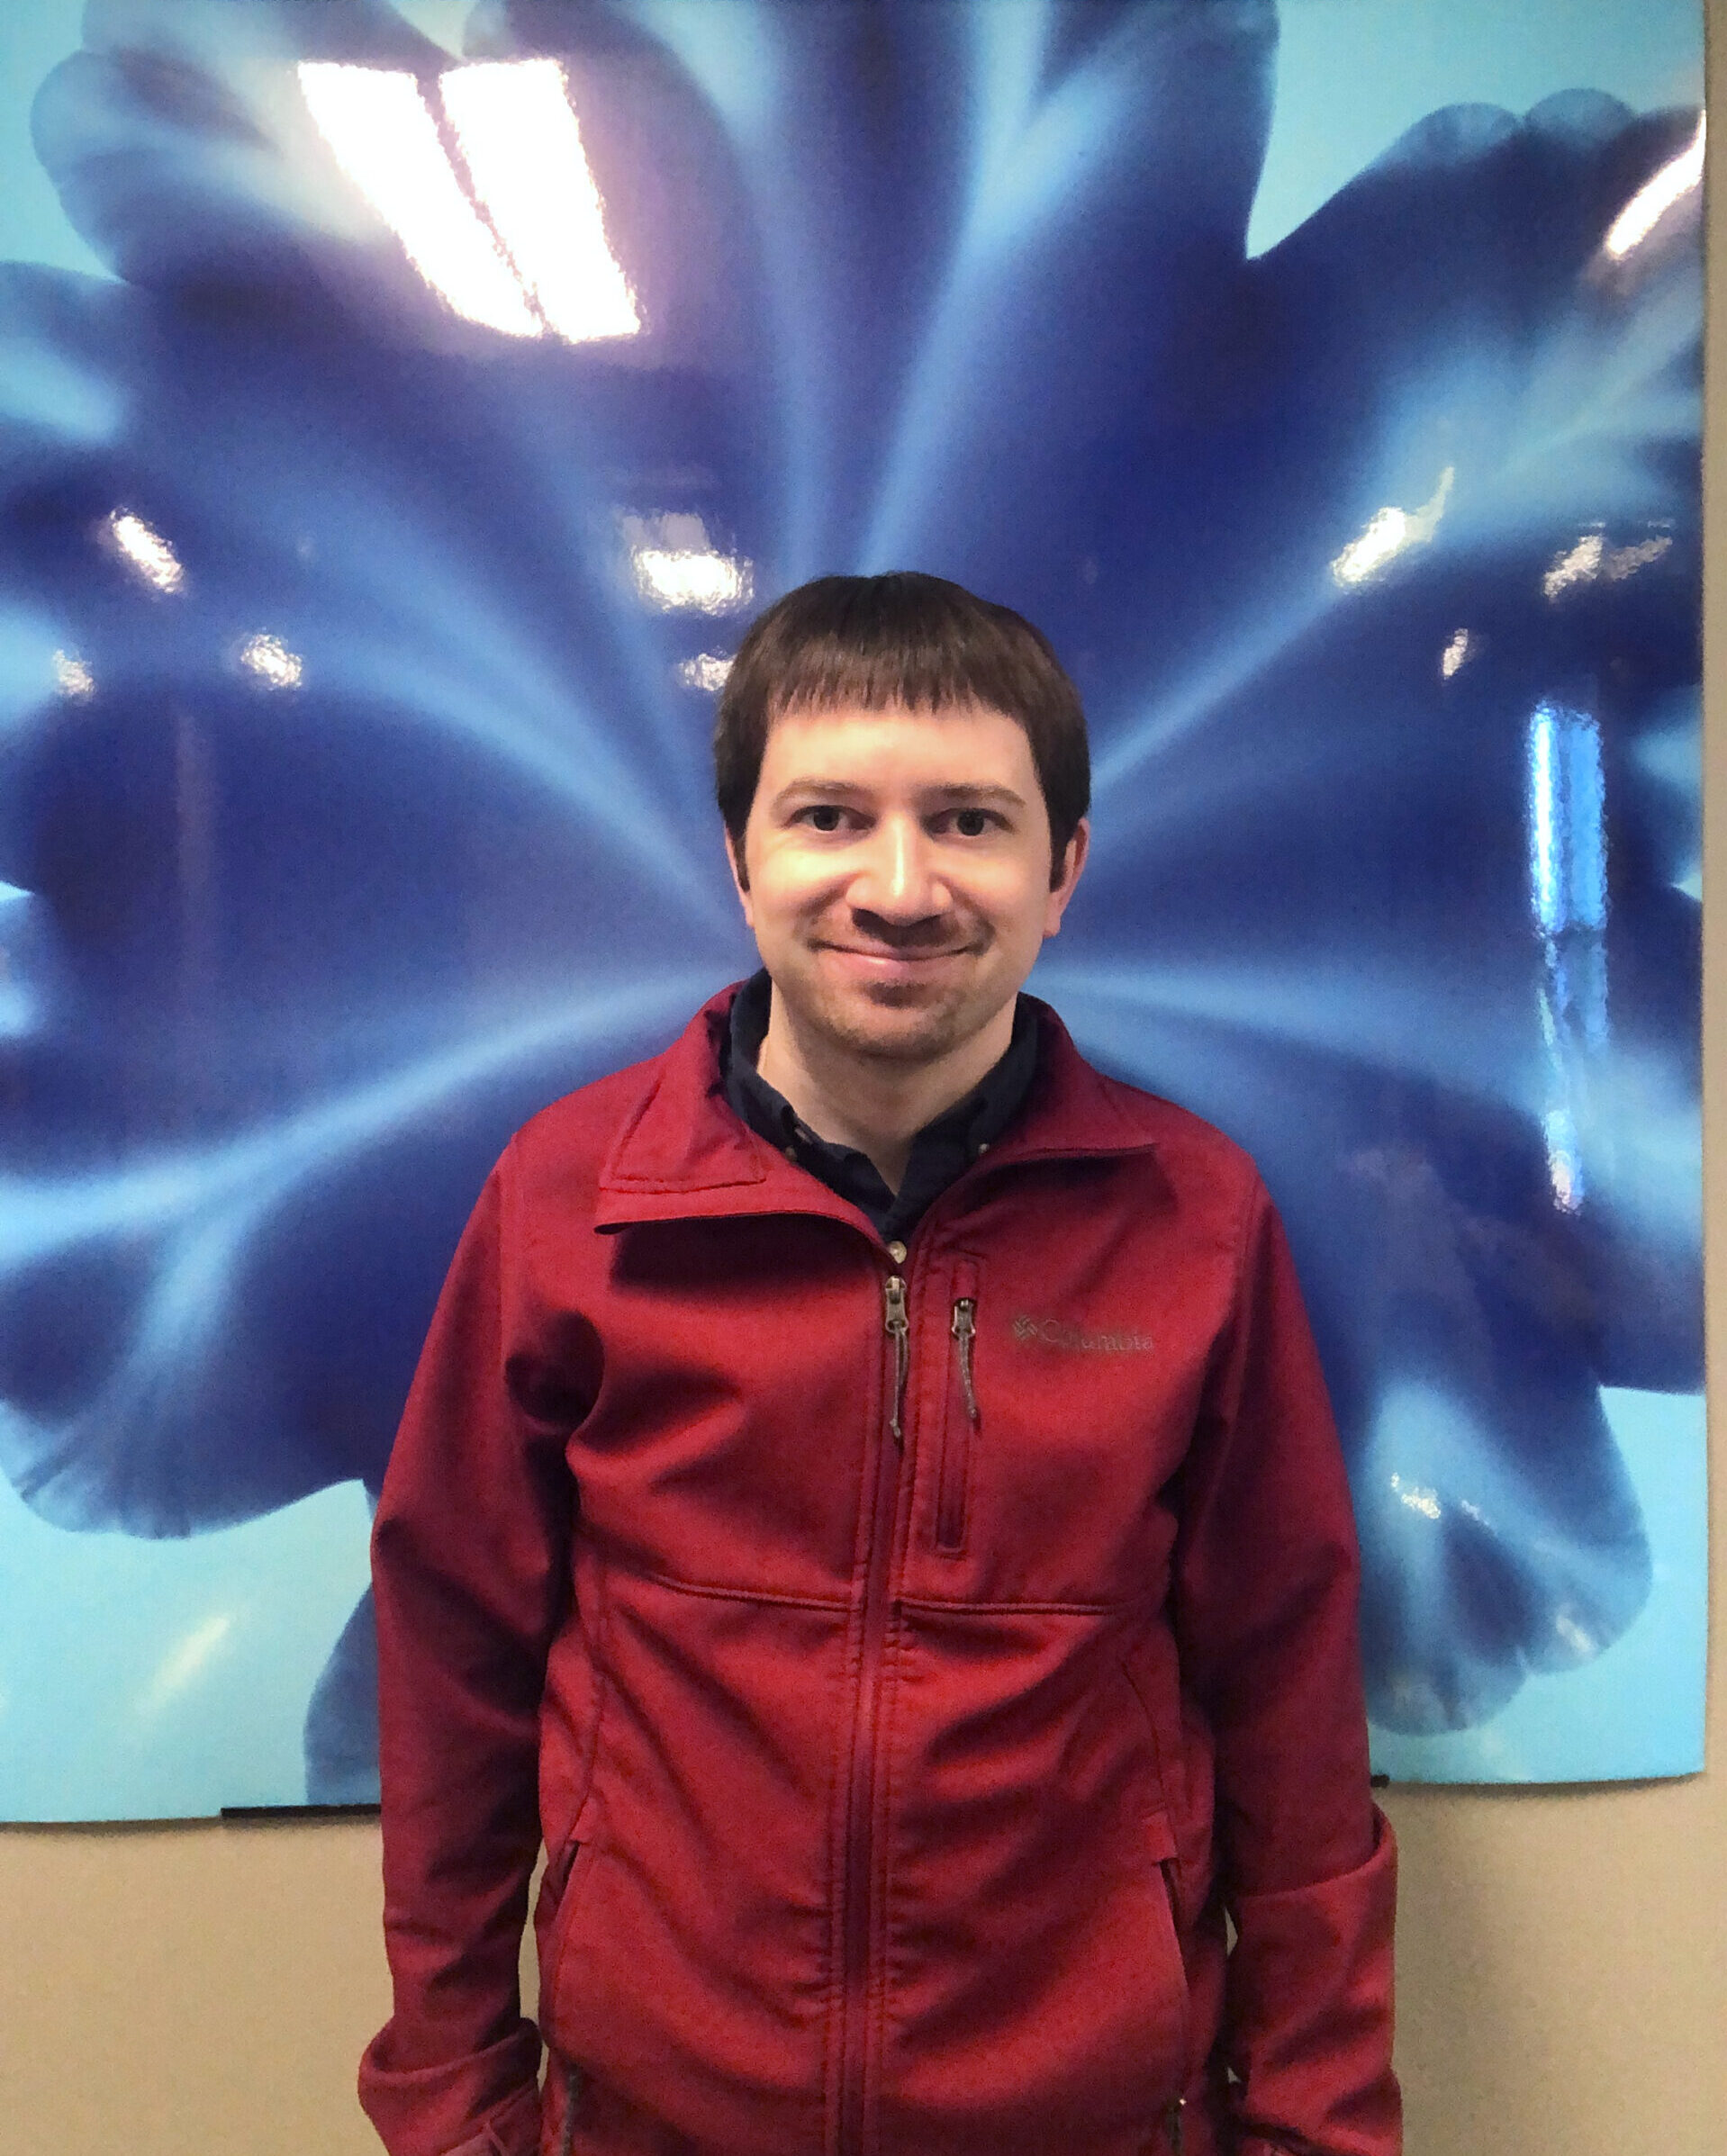
 Ross is the author of this darchive, and a co-author of the paper featured. He is a professor at William Jewell College in Liberty, Missouri, USA. He works on various projects studying the large-scale structure of the Universe using the millions of galaxies DES observes. These projects include galaxy clustering, correlations of structure with the cosmic microwave background and using the structure of the Universe to infer the redshifts of galaxies. Ross also coordinates Education and Public Outreach efforts in DES, including managing the darchives and social media.