Scientists of the Dark Energy Survey recently compared their measurements of a galaxy cluster to those found using data from the CLASH program on the Hubble Space Telescope. Their work shows that DES can carry out precise measurements at both large and small scales!
Think back to your last job interview. You probably had to convince your potential employer you could do the job. Perhaps you actually had to give them evidence that you could do the job well.
Believe it or not, this “show us what you’re made of” mentality is also often how science works! When a new program, like The Dark Energy Survey, comes on the scene, it’s the job of the scientists to demonstrate to the rest of the astrophysics community how the new instrument, data, and analysis techniques will contribute to growth of knowledge and a better understanding of our universe.
A typical way to “show your stuff” is to compare data and results from early in a program to well-established results from other surveys.
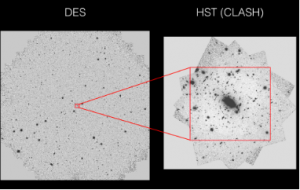
Figure 1. Comparison of DES area to CLASH area. CLASH observes only a small fraction of one chip of the total DES field of view.
In their latest project, that’s just what Antonella Palmese and her collaborators in DES have done. By comparing several properties of a particular galaxy cluster, RXJ22481, from DES Science Verification Data, to those obtained from the Hubble Space Telescope Cluster Lensing and Supernova Survey (CLASH), they have demonstrated how DES can get the job done as well.
Why compare to CLASH? Most importantly, space-based projects observe objects, like galaxy clusters, with incredible precision. This is because projects like CLASH observe a very small area of the sky over a very long period of time. CLASH should have the most precise measurements over the small area it observes. What DES brings to the table is a much bigger field of view (see Figure 1). If DES agrees with the precise CLASH measurements on objects they both observe, then we can have greater confidence that the DES results over the much larger area are fairly accurate as well. DES and CLASH also observe the sky in similar filters, which means they have measurements of RXJ2248 at roughly the same wavelengths (or colors) of light. More comparisons of DES and CLASH are shown in Table 1.
| DES | CLASH | |
| Observations | From CTIO in Chile | In Space! |
| Colors | 5 bands in the Visible Spectrum2 | 16 bands in the Infrared, Visible, and Ultraviolet Spectra |
| Area | 2.2 deg2 | 0.003 deg2 and 0.001 deg2 |
| Number of objects in RXJ2248 area | 374, 294 | 3, 471 |
Table 1: Comparison of the observing parameters of DES and CLASH. While CLASH has more precision being in space, and observes more colors, DES observes a far greater area.
Palmese primarily used two properties of the galaxy cluster to compare the two surveys: photometric redshifts and stellar mass. She compared the computed photometric redshifts, derived from the observed colors, for 155 sources in both surveys and found that 85% of the DES redshifts roughly matched those from CLASH. She hypothesizes the differences may stem from the fact that CLASH can use a larger range of wavelengths (more colors) to compute a redshift. These photometric redshifts are essential for computing other properties, like stellar mass. “In order to estimate the stellar mass of a galaxy, we need to know how distant it is from us because distance and color are correlated,” Palmese says.
The DES scientists had another tool to figuring out the redshift and thus distance to objects as well. Palmese explains that “when gravity clusters galaxies together, all the galaxies will all be at a very similar distance from us and we can use this information to better estimate the distance. Our DES collaborators created some very clever codes to estimate the redshift of galaxy clusters very precisely, so we thought: why not use DES data to study the stellar masses in clusters?” Palmese used these redshifts to compute the stellar masses and found that DES and CLASH results again agreed! This agreement tells us that the DES measurements are indeed “showing their stuff”.
Palmese pushed the analysis further and compared the total cluster mass observed by DES and by CLASH, to the computed stellar mass. While stellar mass is a useful tool for determining how much material is in a cluster, it cannot tell us about the material we cannot see: to learn about other matter, such as dark matter, we have to use another tool. Palmese used masses computed from weak gravitational lensing measurements from other DES projects, and statistical model best-fits to data. Figure 2 shows how total mass compares to stellar mass for the DES and CLASH observations.
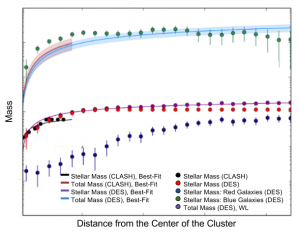
Figure 2. Comparison of mass estimates from DES and CLASH. Near the center of the cluster, the DES and CLASH measurements are fairly close to each other. Only DES has measurements at greater distances from the center.
By taking the ratio of stellar mass to total mass, Palmese can learn about how much stars in a galaxy cluster contribute to the total mass. Palmese finds this ratio, in the inner regions of the cluster, is close to 0.7%. This means that something else, like interstellar gas or dark matter, is actually where the bulk of the cluster mass comes from!
Earlier cosmological surveys, such as Planck, have made measurements to determine, on scales of the entire universe, the ratio of baryonic matter (ordinary matter made from protons and neutrons) to dark matter. Their measurements tell them this ratio is approximately 16%. By combining these measurements with her measurements of stellar mass to total mass, and assuming measurements from RXJ2248 are representative of other galaxy clusters, Palmese finds that only 4% of baryonic matter is contained in stars! Most of the baryonic matter is in diffuse gas between the stars.
Palmese’s analysis demonstrates that even though DES data is not as precise as CLASH, it can still produce competitive scientific results. The large DES area also means that DES can produce competitive results for a large, unexplored region of the sky – and contribute new, exciting science. As DES continues to observe, Palmese plans to use new data to further understand galaxy clusters, and the influence and presence of dark matter.
You can read more about this analysis, Comparing Dark Energy Survey and HST–CLASH observations of the galaxy cluster RXC J2248.7–4431: implications for stellar mass versus dark matter, online on the arxiv.
1. Full name: RXC J2248.7–4431. RXC stands for ROSAT X-ray Cluster, the rest refers to its position in the sky in equatorial coordinate system: right ascention and declination: 22:48:44.29 -44:31:48.4
2. https://en.wikipedia.org/wiki/Visible_spectrum
About the Paper Author
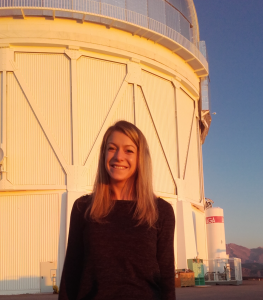
Antonella Palmese is a PhD student at University College London. Before moving to London, she graduated in Physics (BSc) and in Astronomy and Astrophysics (Masters) at La Sapienza University of Rome. While her studies focus on theoretical cosmology, at the moment she is focusing on observational astrophysics with DES. Her main interest is studying stellar masses of galaxies, and she has also been involved in the estimation of their redshift. She also works on gravitational redshifts in galaxy clusters.
About The DArchive Authors & Editors
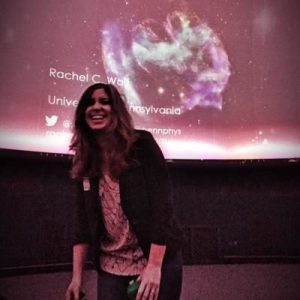
Rachel C. Wolf is an astrophysics PhD candidate at the University of Pennsylvania. She is primarily interested in how to best use Type Ia supernovae to understand more about the evolution of our universe. Most of her work has focused on studying correlations between supernova brightness and host-galaxy properties and on creating new statistical techniques to compare observational data to cosmology theory. Rachel is also very passionate about science education and public outreach. She is involved in many projects in the Philadelphia community and serves as one of the co-coordinators of Education & Public Outreach for DES.
Chicago. He works on various projects studying the large scale structure
of the Universe using the millions of galaxies DES observes. These
projects include galaxy clustering, correlations of structure with the
cosmic microwave background, and using the structure of the Universe to infer redshifts of galaxies. Ross is also an active science communicator, volunteering at Chicago’s Adler Planetarium as well as writing and editing for The Darchives. He also loves observing for DES in Chile, where he has observed more than 30 nights.