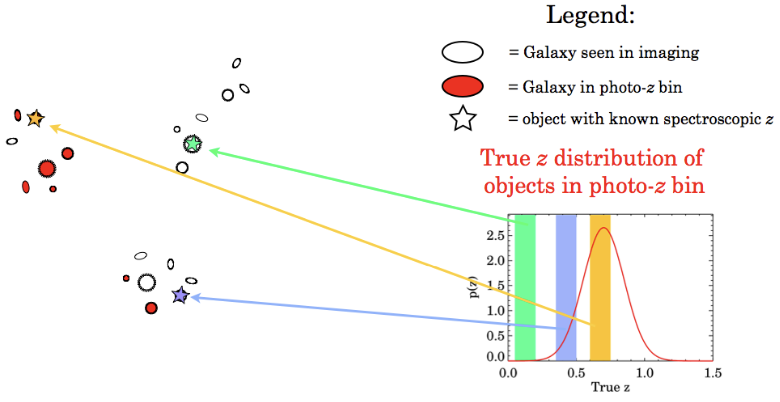
Figure 3: This figure demonstrates the clustering redshift method. The stars represent objects (typically galaxies) where we know the spectroscopic redshift (spec-z). A sample of DES galaxies (red circles) has its clustering to each of the spectroscopic galaxies measured. In the figure, a large amount of clustering to the yellow spec-z galaxy, a small amount to the blue spec-z galaxy, and zero amount to the green spec-z galaxy is seen, numerically producing the plot on the right.