This DArchive describes some of the process in making the Dark Energy Survey data set described in ‘Dark Energy Survey Year 1 Results: Photometric data set for cosmology‘
Raw astronomical images are beautiful. Little pinpricks of white scattered on a dark background compose a medley of stars, galaxies, and myriad other sources of light. To the casual observer, this is an archetypical piece of astronomical data. To a cosmologist, in this form, the image is pretty useless.
From the moment a photon lands on a CCD – one of the imaging chips that makes up the Dark Energy Camera (DECam) – it must pass through an obstacle course of calibrations, transformations, and calculations before finding its way into a catalog of objects. This catalog is a cohesive listing of all relevant sources of light observed by DECam, and is the springboard for DES’s many explorations into the composition of the universe. Let us follow the progress of a photon as it passes through the DES data processing pipeline.

An airplane photobombing a DES exposure.
The first step is to make sure the image itself is useful. Some reasons to discard an image are:
- Really bright stars reflecting off the telescope hardware and obstructing the entire image.
- Dome occlusions: sometimes when the telescope rotates a long way, the camera starts taking an image before the dome – the ceiling of the structure housing the telescope – finishes rotating to catch up.
- Airplanes flying through the field of view.
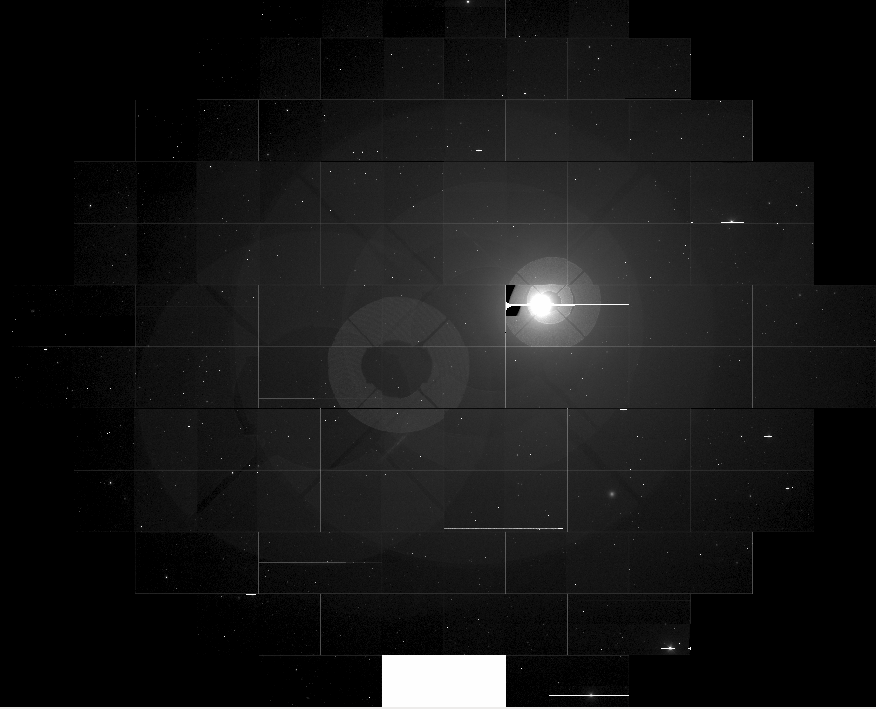
Achernar, aka Alpha Eri, the 10th brightest star in the sky, reflects off the structures that hold up DECam – right onto our image.
Images that are deemed worthy continue on their journey through the pipeline. The first set of calibrations make the images usable for everyone, without any prior knowledge about the telescope or instrumentation necessary. Among other fixes, they:
- Remove background noise produced by DECam.
- Make flatfield corrections – the camera does not always detect light uniformly across the field of view. Every afternoon before a night of observations, we take images of a large piece of aluminum painted with a special white material that gives it a near-perfect matte finish. Ideally, these images should be perfectly uniformly white – any variations in brightness point out which areas need to be corrected in images taken the following night, and tell us how much to correct by.
-
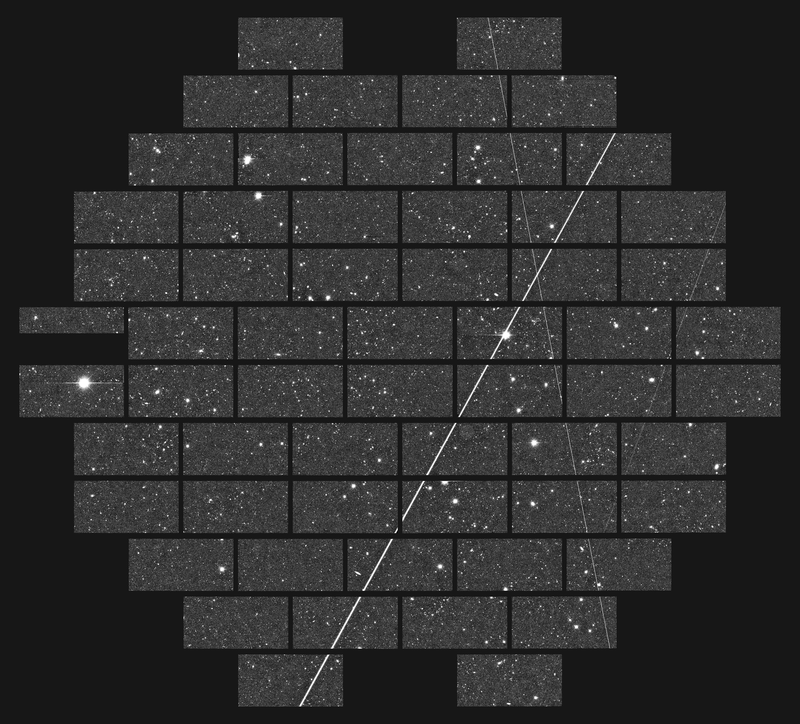
Satellites passing through a DECam image.
Adjust coordinates of each image to make sure we know where we are pointing – when the telescope moves from one area of the sky to the next, it ends up very close to its destination, but due to mechanical limitations is usually off by a very small amount. To make sure we measure object positions accurately, we find previously-discovered stars in each image, and align the image so the coordinates of these stars match their known positions.
- Remove “artifacts” – objects that intrude upon our images. Stars that are not bright enough to mess up an entire image can still sometimes “spill over” into camera pixels they should not occupy. Cosmic rays give off energy as they pass by, producing little worm-like structures in our images. Satellites and meteorites passing by – objects we eagerly try to spot with our eyes – are only nuisances when they show up in our data.
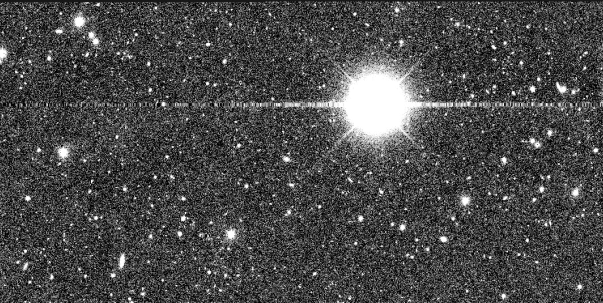
A bright star “spills over” into the row of nearby pixels.
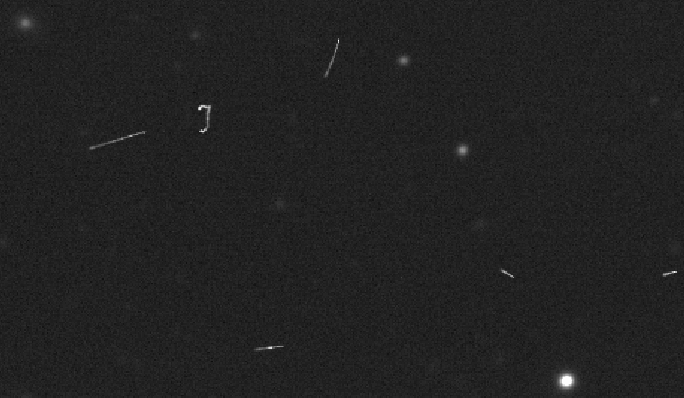
Lots of cosmic rays! (Odd-looking wiggly or straight lines.)
After these fixes, we create a catalog – a list of all sources of light in the resulting image. This catalog contains information on the position of each object, how bright it is, and how bright the background sky is.
However, these brightnesses do not quite mean anything yet. External factors, such as atmospheric conditions or dust on the telescope optics, can make the brightness of an object vary from night to night. There is a long string of corrections – known as photometric calibrations – to undo these effects. In the first step, we take a few images each night of dense star fields, where we already know the properties of the stars from previous astronomical surveys. By comparing the known brightnesses of these stars to how bright they look each night in our data, we can measure the external effects and remove them from images taken that night. Further steps correct for this effect on nights where we could not observe the star fields, and run tests to double- and triple-check the quality of these corrections. Following these, we are finally done with calibrations for individual images.
But the journey does not end there.
The point of DES is to overlay many images of the same parts of sky. This helps us measure object properties with far greater precision, and lets us detect objects that are too faint to find in any one image. The area of sky DES looks at – its “footprint” – is divided into about ten thousand sections called “tiles.” Each tile is observed multiple times, using five different optical filters. Each filter lets in a certain range of light. Comparing the brightnesses of an object through different filters gives us information on that object’s true color.
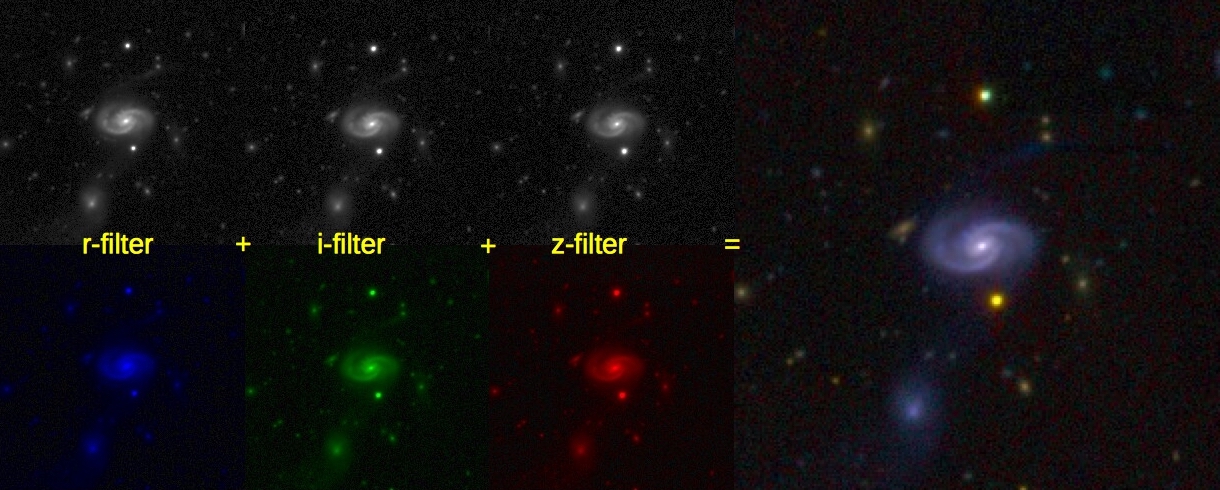
Seen here are three images of the same galaxy, taken with the r, i, and z filters. The original images are all black-and-white (above). The brightness of each image gives us information about how much of each type of light we detect from the galaxy – i.e., how “red” an object is, etc. Putting this information together, we can generate a colored image of the galaxy. As some of our filters provide information about non-visible light (i.e. infrared), this image does not show us exactly what the galaxy would look like to our eyes, but gives us a sense of its color relative to the other objects we see.
Multiple images of each tile, grouped by filter type, are stacked on top of each other. Each tile ends up with five stacked images, each one containing information from several images using the same filter. We then use these stacked images – also called coadded images – to create a new object catalog with one entry per object in the footprint, combining information from all images and filters. This catalog contains more precise information on object positions, their brightnesses through each filter, and a whole host of other data for each source of light.
This catalog must now undergo quality cuts. Objects are removed for several reasons, including:
- They are only visible through some filters, but not all.
- They are too close to bright stars, which affect the light that reaches us from these objects.
- Their positions vary from filter to filter.
- The relative observed brightnesses through different filters are clearly off – i.e., the objects are “too blue” or “too red” compared to what actual cosmic objects look like.
- They are too close to us. Large objects in the foreground are some of the most beautiful parts of our images – sprawling spiral galaxies, magnificent globular clusters, the nearby Large Magellanic Cloud. When it comes to making actual cosmological measurements though, they are only nuisances, getting in the way of data from our precious background galaxies.
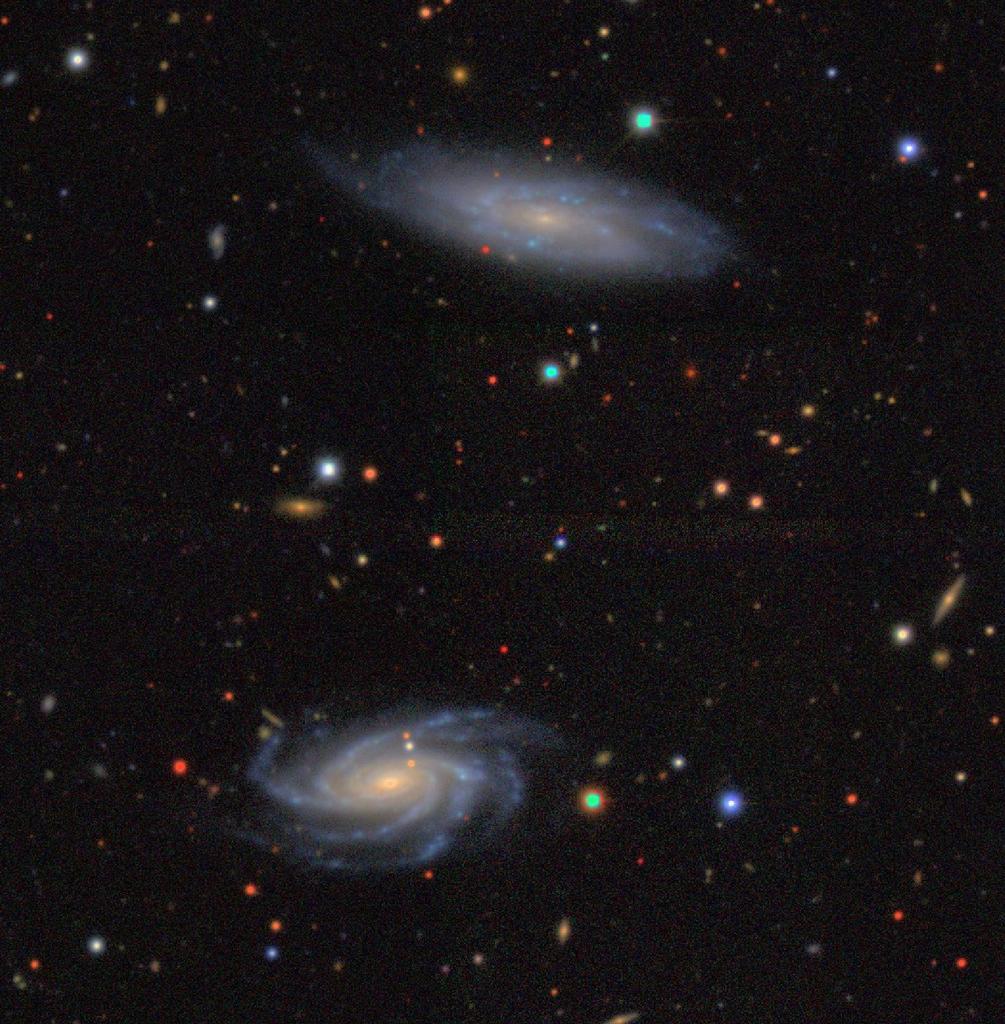
Spiral galaxies in the foreground. Image credit: Erin Sheldon
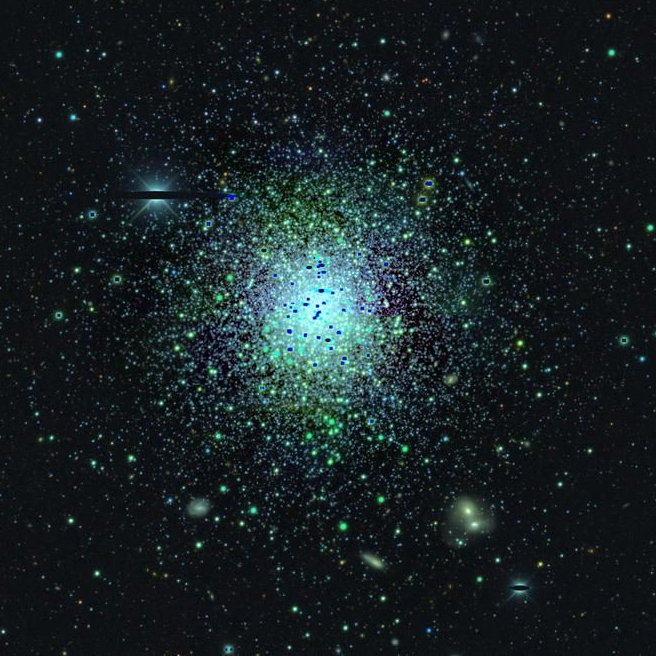
A globular cluster (center) getting in the way of observations of a possible galaxy cluster (lower right).
The remaining set of objects live up to our gold standards for data, and are thus collectively known as the “GOLD” catalog.
After passing through innumerable cuts, calibrations, image combinations, and cataloging, the photons that had landed on our camera have finally made their way into a usable form. There are still many more measurements to be made – object shapes, redshifts, classifications – but for now, we finally have a gold-standard catalog of the hundreds of millions of sources of light in the sky that we can use to do science.
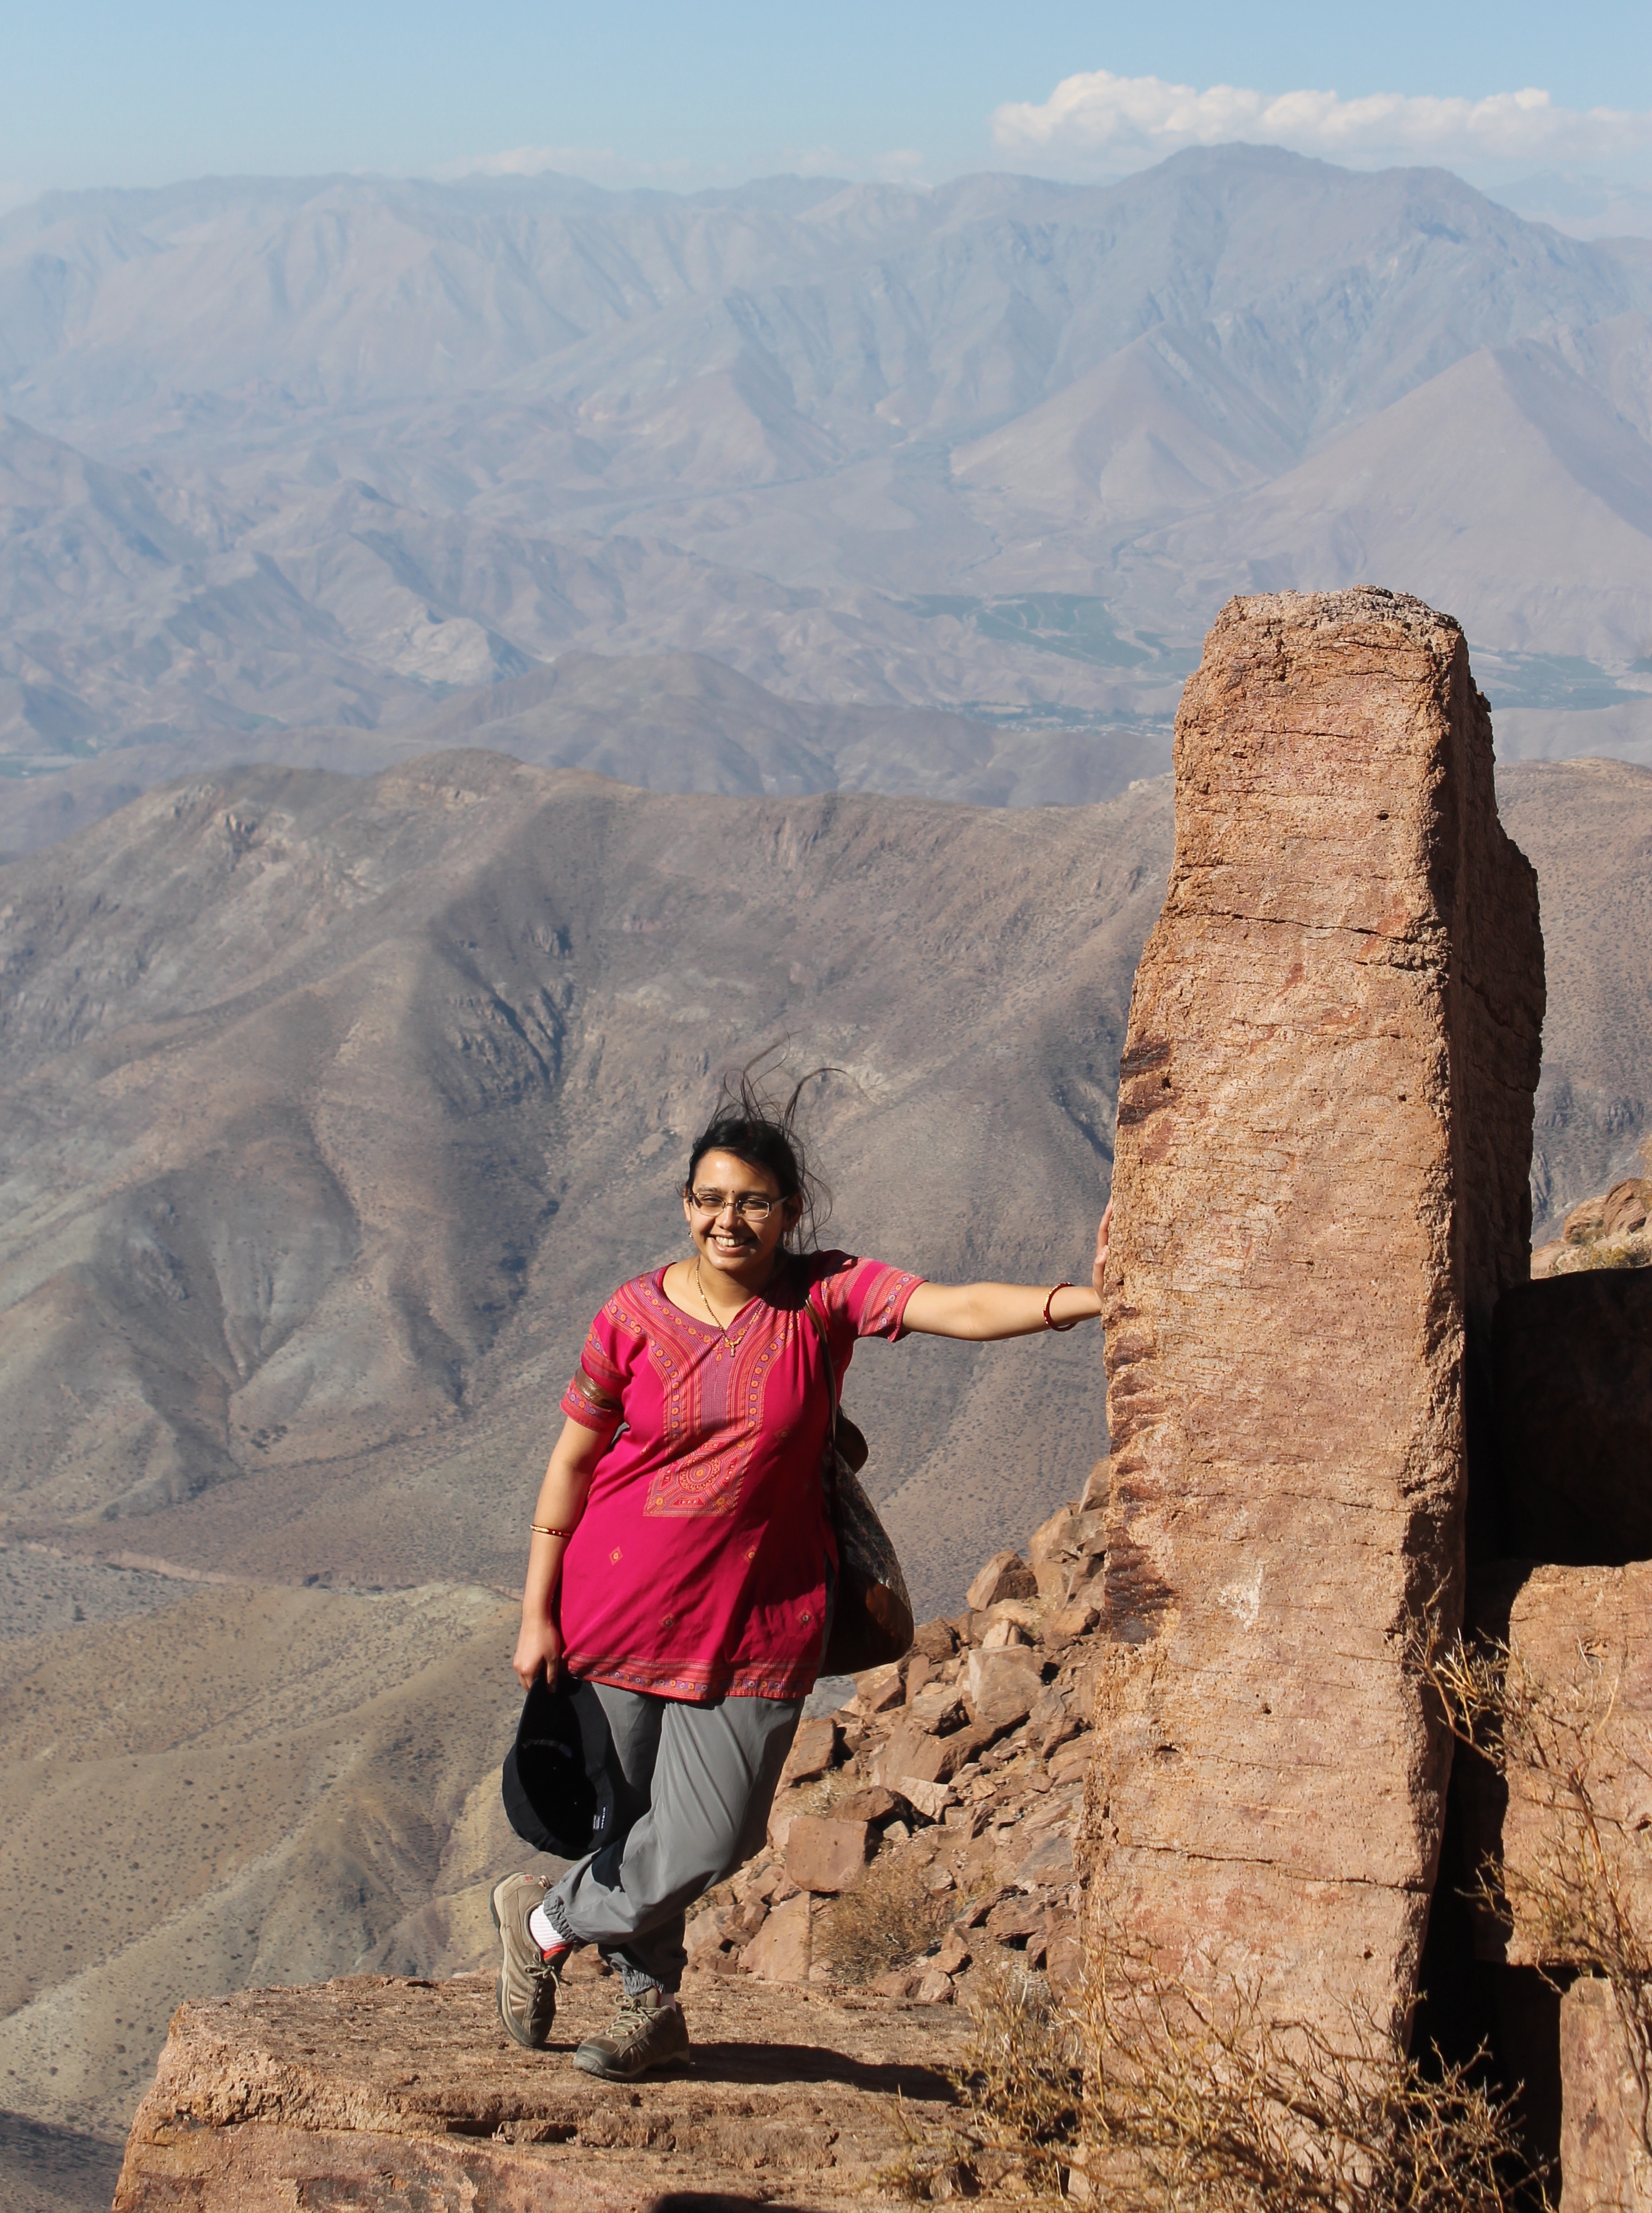
Author: Rutuparna Das
Rutu is a physics PhD candidate at the University of Michigan. Her main work focuses on studying the universe by looking at clusters of galaxies and how they bend light as it passes by them. She loves to go observing for DES, and has spent over 40 nights at CTIO taking data (and staring at the night sky). She is also highly passionate about spreading her love for the universe, and takes part in several science outreach and education efforts.
Author: Alex Drlica-Wagner
Alex is the lead author on the paper Dark Energy Survey Year 1 Results: Photometric Data Set for Cosmology. Alex is a Schramm Fellow at Fermi National Accelerator Laboratory (FNAL) in Batavia, Illinois. His research interests are focused on satellite/dwarf galaxies, dark matter and gamma rays. In his spare time, he throws disk with the Chicago Wildfire. Alex has been at FNAL since 2013.
Editor: Ross Cawthon
Ross is an astrophysics PhD candidate at the University of Chicago. He works on various projects studying the large scale structure of the Universe using the millions of galaxies DES observes. These projects include galaxy clustering, correlations of structure with the cosmic microwave background, and using the structure of the Universe to infer redshifts of galaxies. Ross is also an active science communicator, volunteering at Chicago’s Adler Planetarium as well as writing and editing for The Darchives. He also loves observing for DES in Chile, where he has observed more than 30 nights.