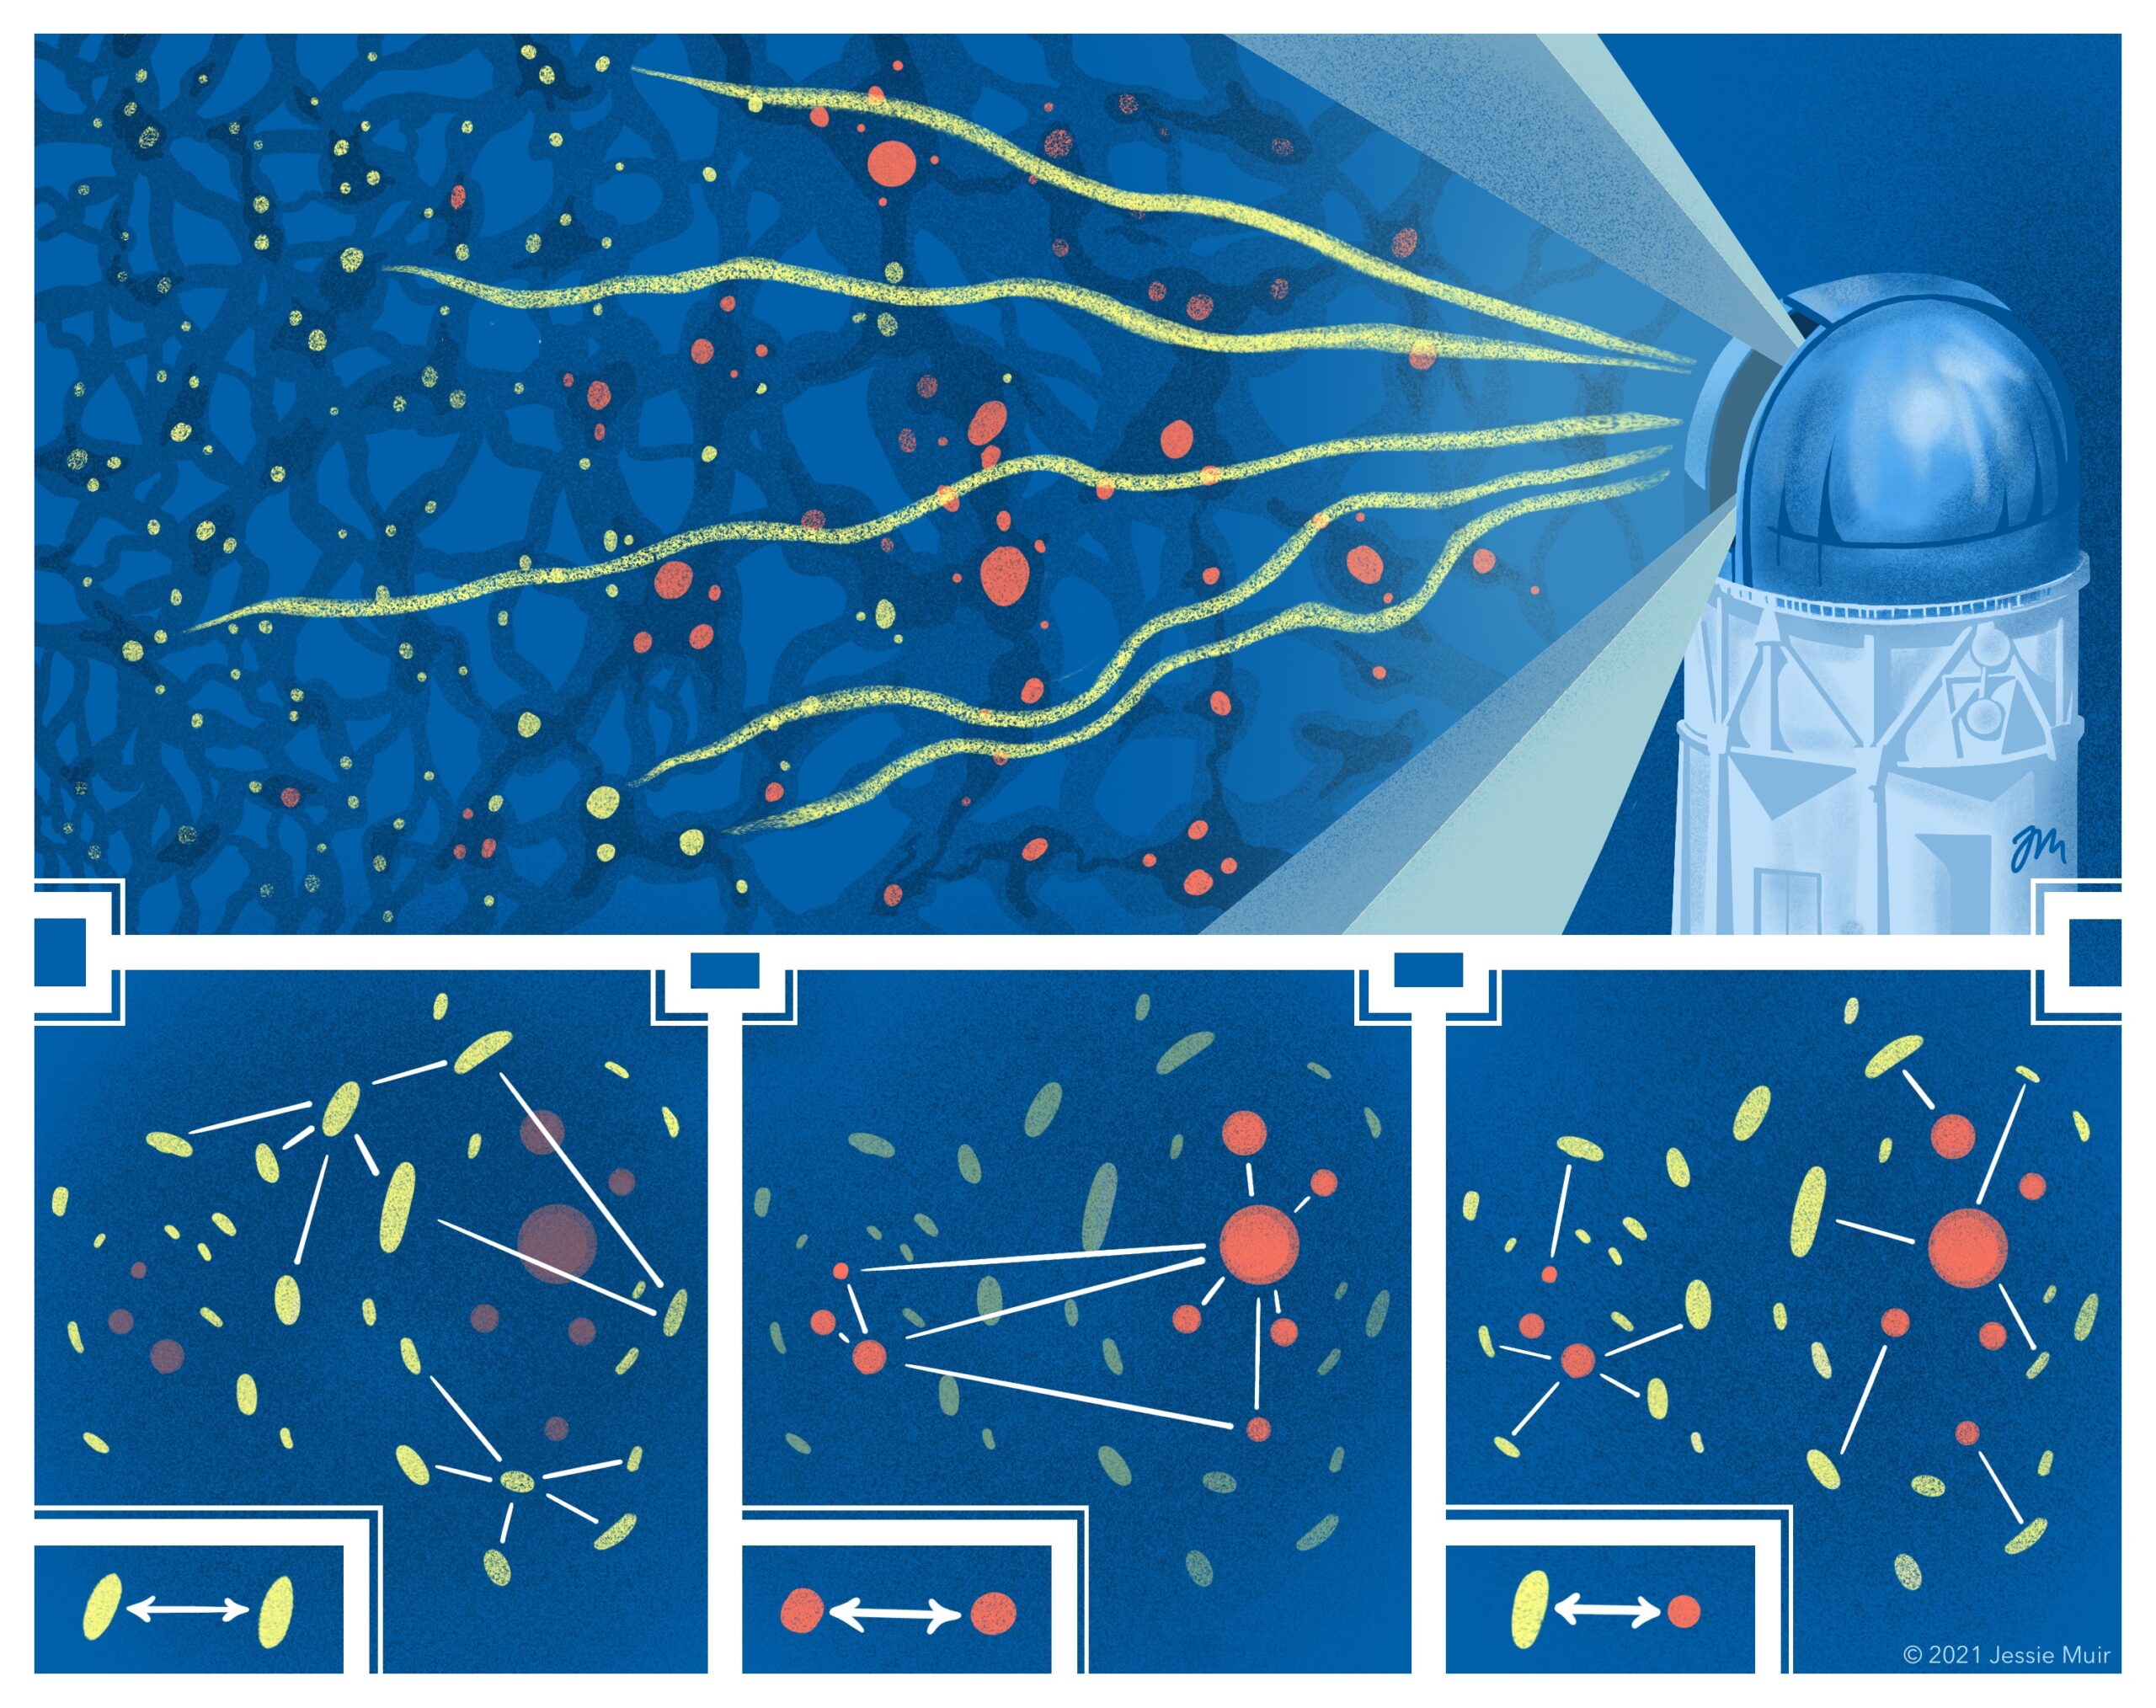
Figure 2: The three separate two-point correlations used by DES scientists to map the distribution of matter in the Universe. The DES analysis uses shape measurements of source galaxies, shown in yellow, and the positions of lens galaxies, shown in red. Bottom row, left to right: shear-shear correlations, galaxy-galaxy correlations, and galaxy-shear correlations (explained below). (Credit: Jessie Muir.)
A drawing showing light rays travelling in windy paths due to gravitational lensing to a telescope on the right.